Fraud Detection Metrics: Formulas and a Measurement Plan


The short answer
Fraud detection metrics are the numbers that show whether a fraud tool works on your own transactions. Track six: fraud rate, chargeback rate, false positive rate, approval rate, manual review rate and step-up conversion. Write the definitions into your vendor contract, log every decision against one order ID, review the numbers weekly and send each alert to a named owner.
Why review scores can't tell you how a fraud tool will perform
Analyst and peer-review listings, such as the online fraud detection category on Gartner Peer Insights, are a good way to build a vendor shortlist. They say little about what a specific vendor will do to your approval rate, your chargeback exposure or your customer experience once it is live on your own transaction mix.
Few vendors offer to show you, in your own numbers, whether a lift in approval rate still holds ninety days after signature. You can get that answer yourself with a measurement plan you own, independent of any vendor dashboard. That plan has three parts: shared metric definitions, end-to-end instrumentation, and a fixed reporting cadence with alert thresholds.
What are the six fraud detection metrics?
Six metrics tell the full story of a fraud program. Agree on the definitions before you sign, and put them in the vendor contract as well as your internal wiki. A vendor who resists a shared definition is telling you something.
- Fraud rate: confirmed fraud dollars divided by total transaction dollars.
- Chargeback rate: chargebacks divided by transactions, tracked by count and by dollar value.
- False positive rate: legitimate orders declined, divided by all legitimate orders attempted.
- Approval rate: approved transactions divided by attempted transactions.
- Manual review rate: orders routed to human review, divided by total orders.
- Step-up conversion rate: customers who complete an added verification step, such as 3D Secure, divided by customers presented with it.
Definitions and formulas
| Metric | Definition | Formula |
|---|---|---|
| Fraud rate | Share of transaction value confirmed as fraudulent | Confirmed fraud $ ÷ total transaction $ |
| Chargeback rate | Share of transactions disputed by a cardholder | Chargebacks ÷ total transactions (by count and by $) |
| False positive rate | Share of legitimate orders that were declined | Legitimate orders declined ÷ all legitimate orders attempted |
| Approval rate | Share of attempted transactions cleared for payment | Approved transactions ÷ attempted transactions |
| Manual review rate | Share of orders sent to a human reviewer | Orders routed to review ÷ total orders |
| Step-up conversion | Share of customers completing added verification | Completed step-up challenges ÷ challenges presented |
Getting the false positive rate right
A false positive, also called a false decline, is a legitimate order your system declines. The false positive rate measures how many of your good customers you turn away, so its denominator is all legitimate orders, not all declines.
Some teams also track the share of declines that turned out to be legitimate (legitimate declines ÷ total declines). That number is a useful check on decision quality, but it is a different metric. Label it separately so the two are never compared as if they were the same thing.
You will rarely know for certain that a declined order was legitimate. Estimate it from evidence you can collect: a customer who retries and succeeds with the same card, complaints to customer service, and periodic manual sampling of declined orders.
How your chargeback rate differs from Visa's VAMP ratio
Your internal chargeback rate is one input. Visa monitors card-not-present merchants with its own measure, the VAMP ratio, which counts fraud reports (TC40) plus disputes (TC15) and divides by the count of settled transactions. Because fraud reports are included, the VAMP ratio can run higher than your chargeback rate alone. Track both, and reconcile them each month against your processor's reports. For the current thresholds and how they apply, see our guide to Visa VAMP thresholds.
How should you instrument fraud decisions?
A fraud score on its own tells you very little. Log the fraud decision, the review outcome and the final chargeback outcome against the same order ID so you can trace one transaction from end to end. Capture a timestamp at each stage: authorization, review assignment, review resolution and chargeback filing. Tag every declined order with a specific reason code. Without this discipline, a fraud problem and a friction problem look identical in your reporting.
Instrumentation checklist
- Assign one order ID that persists across authorization, review and settlement systems.
- Log a specific reason code for every decline, beyond a simple accept or reject flag.
- Capture timestamps for authorization, review assignment, review resolution and chargeback filing.
- Store false positive corrections as a dedicated field linked to the original order ID.
- Record step-up challenges presented and step-up challenges completed as separate events.
- Tag every manual review with an outcome: approved, declined or escalated.
- Feed chargeback outcomes back into the fraud model's training data on a fixed schedule.
- Reconcile fraud, chargeback and review data monthly against your payment processor's records.
Good instrumentation also helps you spot attacks early. A sudden spike in small authorization attempts and declines from the same cards or BINs is a classic sign of card testing, and it will distort every metric above if you don't isolate it.
How often should you review fraud metrics?
Review all six metrics every week. Fraud patterns move faster than a quarterly business review. Set an alert threshold for each metric, route each alert to a named owner instead of a shared inbox, and report the same six numbers to leadership every month in the same format. That way a change in performance shows up right away instead of at contract renewal.
Suggested cadence and alert triggers
The triggers below are starting points. Tune them to your own baseline and volume after the first 90 days of data.
| Metric | Cadence | Alert trigger | Owner |
|---|---|---|---|
| Fraud rate | Weekly | Rises more than 15% above the trailing 90-day average | Risk or fraud lead |
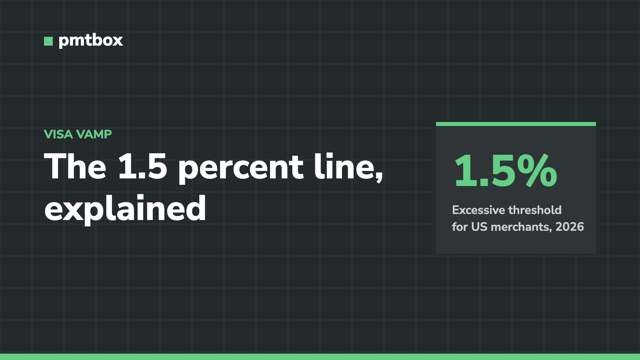
| Chargeback rate and VAMP ratio | Weekly | VAMP ratio moves toward 1.5%, Visa's merchant "Excessive" threshold in the U.S. since April 1, 2026 (set your internal trigger well below it) | Risk or fraud lead |
| False positive rate | Weekly | Rises more than 20% above the trailing 90-day average | Risk lead and CX owner |
| Approval rate | Weekly | Drops more than 3 percentage points week over week | Finance lead |
| Manual review rate | Weekly | Exceeds 10% of order volume for two straight weeks | Operations lead |
| Step-up conversion | Monthly | Drops below 80% | Product or UX lead |
Report all six metrics to the board or leadership team monthly, in the same format each time, with a trend line covering the trailing twelve months.
How pmtbox fits into your measurement plan
pmtbox underwrites e-commerce and retail merchants up front, so the terms are clear before you process. With Fraud Ownership, pmtbox covers fraud on the transactions it approves, which puts the cost of a missed fraud decision on pmtbox instead of on you. Chargeback Automation handles representment, and you pay one fee.
That model makes the plan above more useful. You can watch approval rate and false positive rate to confirm good customers are getting through, and use fraud rate and chargeback data to see the coverage working in your own numbers.
Talk to the pmtbox team about how your current metrics would look under Fraud Ownership.
Frequently asked questions
What is a good false positive rate for an online merchant?
There is no single benchmark, because it depends on your product, price points and customer base. Measure your own baseline first, then hold any vendor to improving it. Make sure every comparison uses the same formula: legitimate orders declined divided by all legitimate orders.
What is the difference between fraud rate and chargeback rate?
Fraud rate measures the share of transaction value confirmed as fraudulent. Chargeback rate measures how often cardholders dispute transactions, which includes non-fraud disputes such as "item not received." A merchant can have a low fraud rate and still have a chargeback problem, so track both.
How does Visa measure disputes for merchants?
Visa uses the VAMP ratio: the count of fraud reports (TC40) plus disputes (TC15), divided by the count of settled card-not-present transactions. From April 1, 2026, the merchant "Excessive" threshold in the U.S., Canada, the EU and Asia Pacific is 1.5%, with a minimum of 1,500 fraud reports and disputes in a month.
Should fraud metrics go into the vendor contract?
Yes. Writing the six definitions into the contract means you and the vendor report the same numbers the same way. It also gives you a clear basis for reviewing performance at renewal.
How often should fraud thresholds be reviewed?
Review the metrics weekly and the alert thresholds themselves at least quarterly. Revisit thresholds sooner after a major change, such as a new product line, a new market or a card network rule update.